
THE CLIMATE IMPACT OF GETTING TO SCHOOL VT
$0.00Graphic uses data to showcase the impact of transportation on our climate.
Showing 22–27 of 27 results
Graphic uses data to showcase the impact of transportation on our climate.
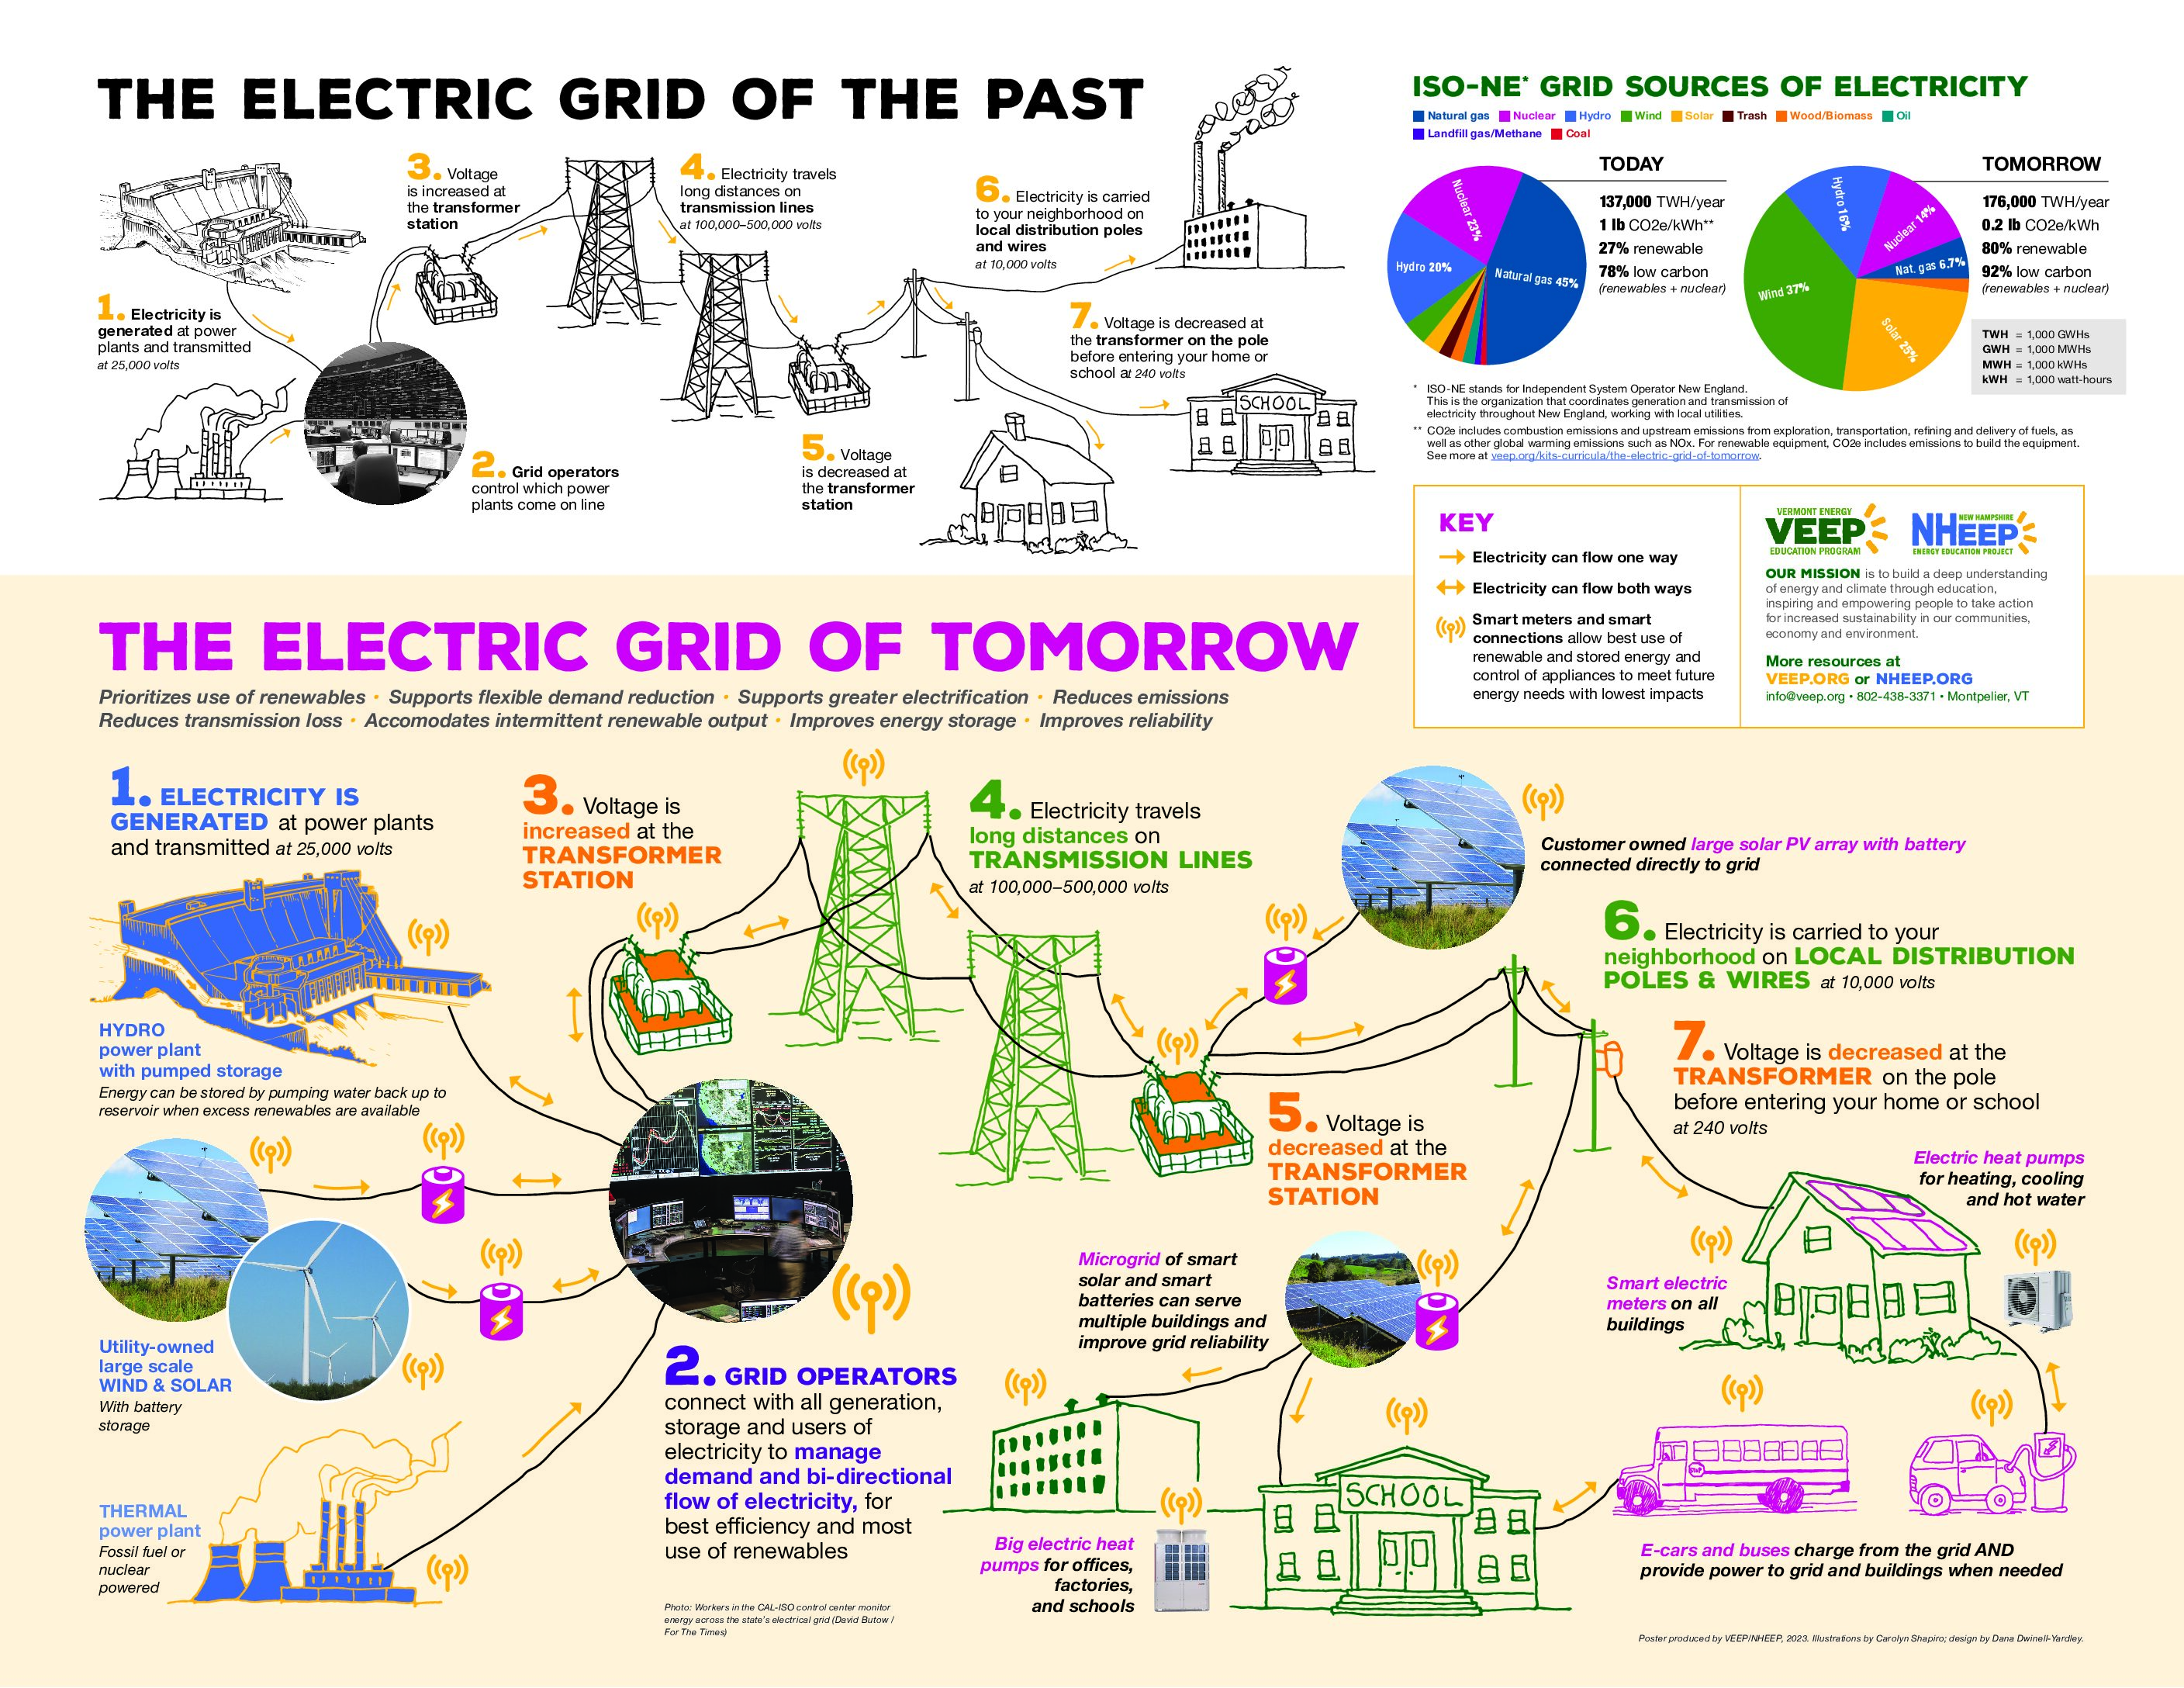
How does the electricity humans generate make it to our homes and businesses? What changes need to happen to make our grid more resilient and efficient for our energy future?…
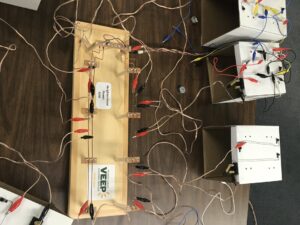
Curricula Kit: How is it that my electrical needs and thousands of others can vary and yet still be met continuously?
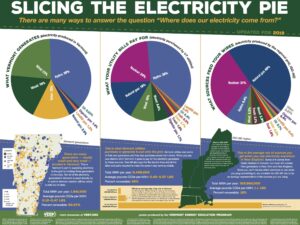
Poster comparing three pie charts of electricity sources: VT generation, what VT utilities purchase, and what comes from the ISO-NE grid.
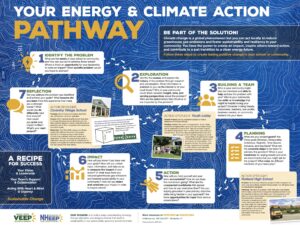
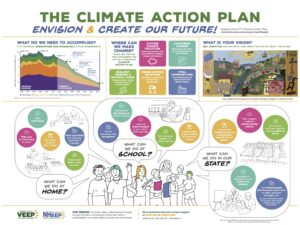
This poster explains the steps that you can take to move your community toward sustainability!