
CHARTING OUR ENERGY FUTURE
$0.00Poster with charts modeling the Vermont Comprehensive Energy Plan.
Showing all 13 results
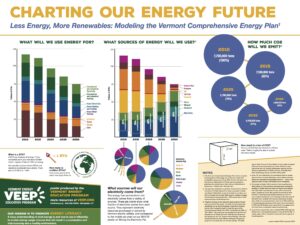
This year’s report highlights how much fossil fuel dependence is currently costing the Vermont economy, as well as how much Vermonters stand to save as a result of a transition to more efficient and renewable technologies in heating and transportation.
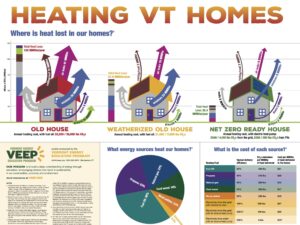
Where does heat leave our homes, what energy sources heat our homes, and what does the energy cost?
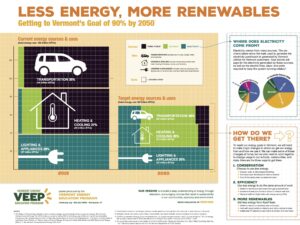
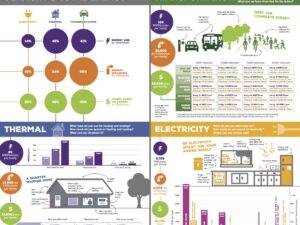
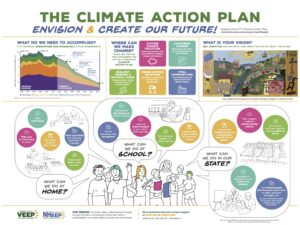
Charts showing Vermont energy use in transportation, thermal, and electricity — and how it would change if we met our state goal of 90% by 2050.
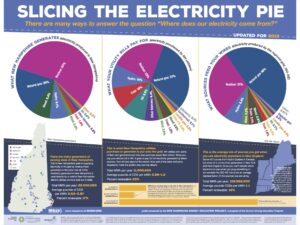
Poster comparing three pie charts of electricity sources: NH generation, what NH utilities purchase, and what comes from the ISO-NE grid.
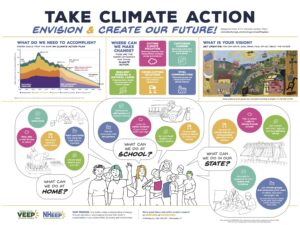
What actions can we take to protect our communities from climate change?
Graphic uses data to showcase how transportation impacts our climate.
Graphic uses data to showcase the impact of transportation on our climate.
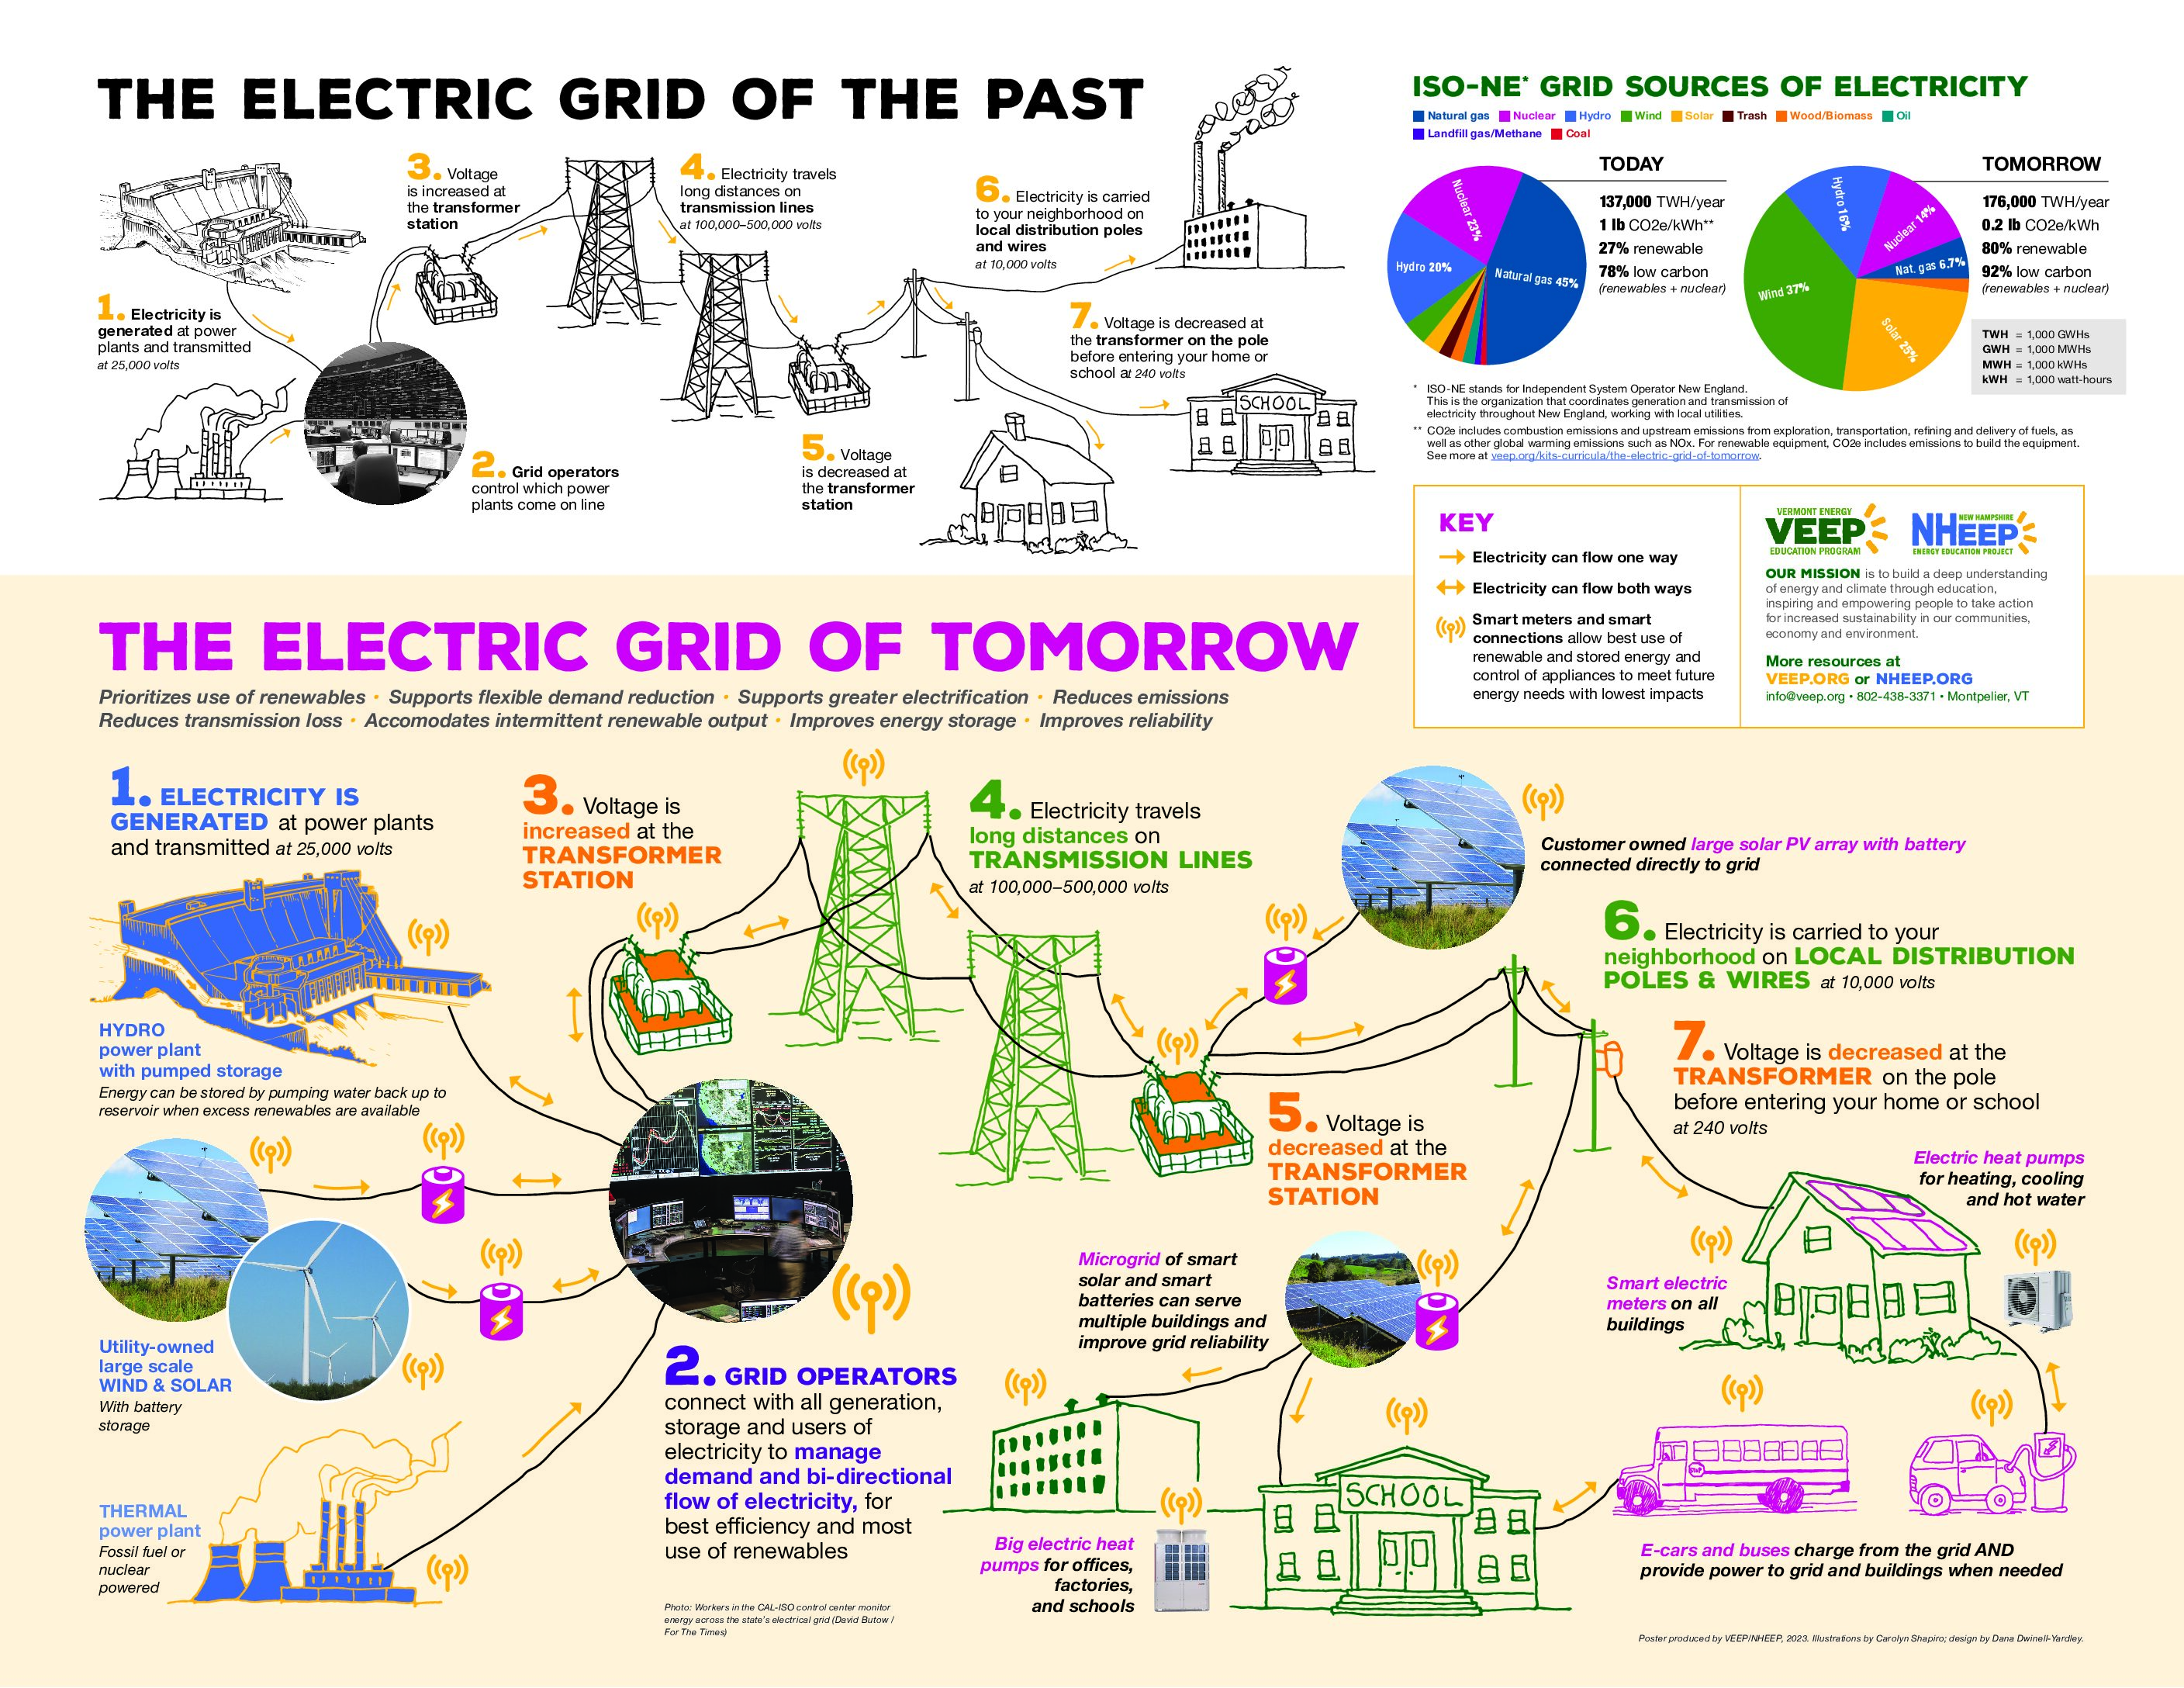
How does the electricity humans generate make it to our homes and businesses? What changes need to happen to make our grid more resilient and efficient for our energy future?…
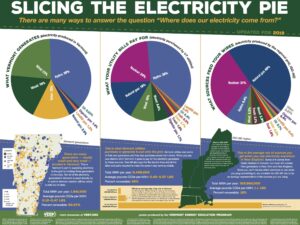
Poster comparing three pie charts of electricity sources: VT generation, what VT utilities purchase, and what comes from the ISO-NE grid.
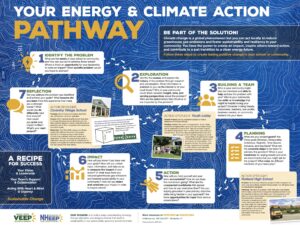
This poster explains the steps that you can take to move your community toward sustainability!