
CHARTING OUR ENERGY FUTURE
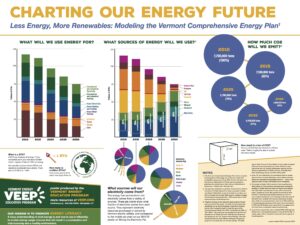
$0.00Poster with charts modeling the Vermont Comprehensive Energy Plan.
Showing all 6 results
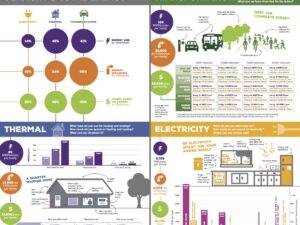
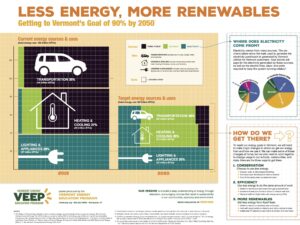
Charts showing Vermont energy use in transportation, thermal, and electricity — and how it would change if we met our state goal of 90% by 2050.
Poster comparing three pie charts of electricity sources: NH generation, what NH utilities purchase, and what comes from the ISO-NE grid.
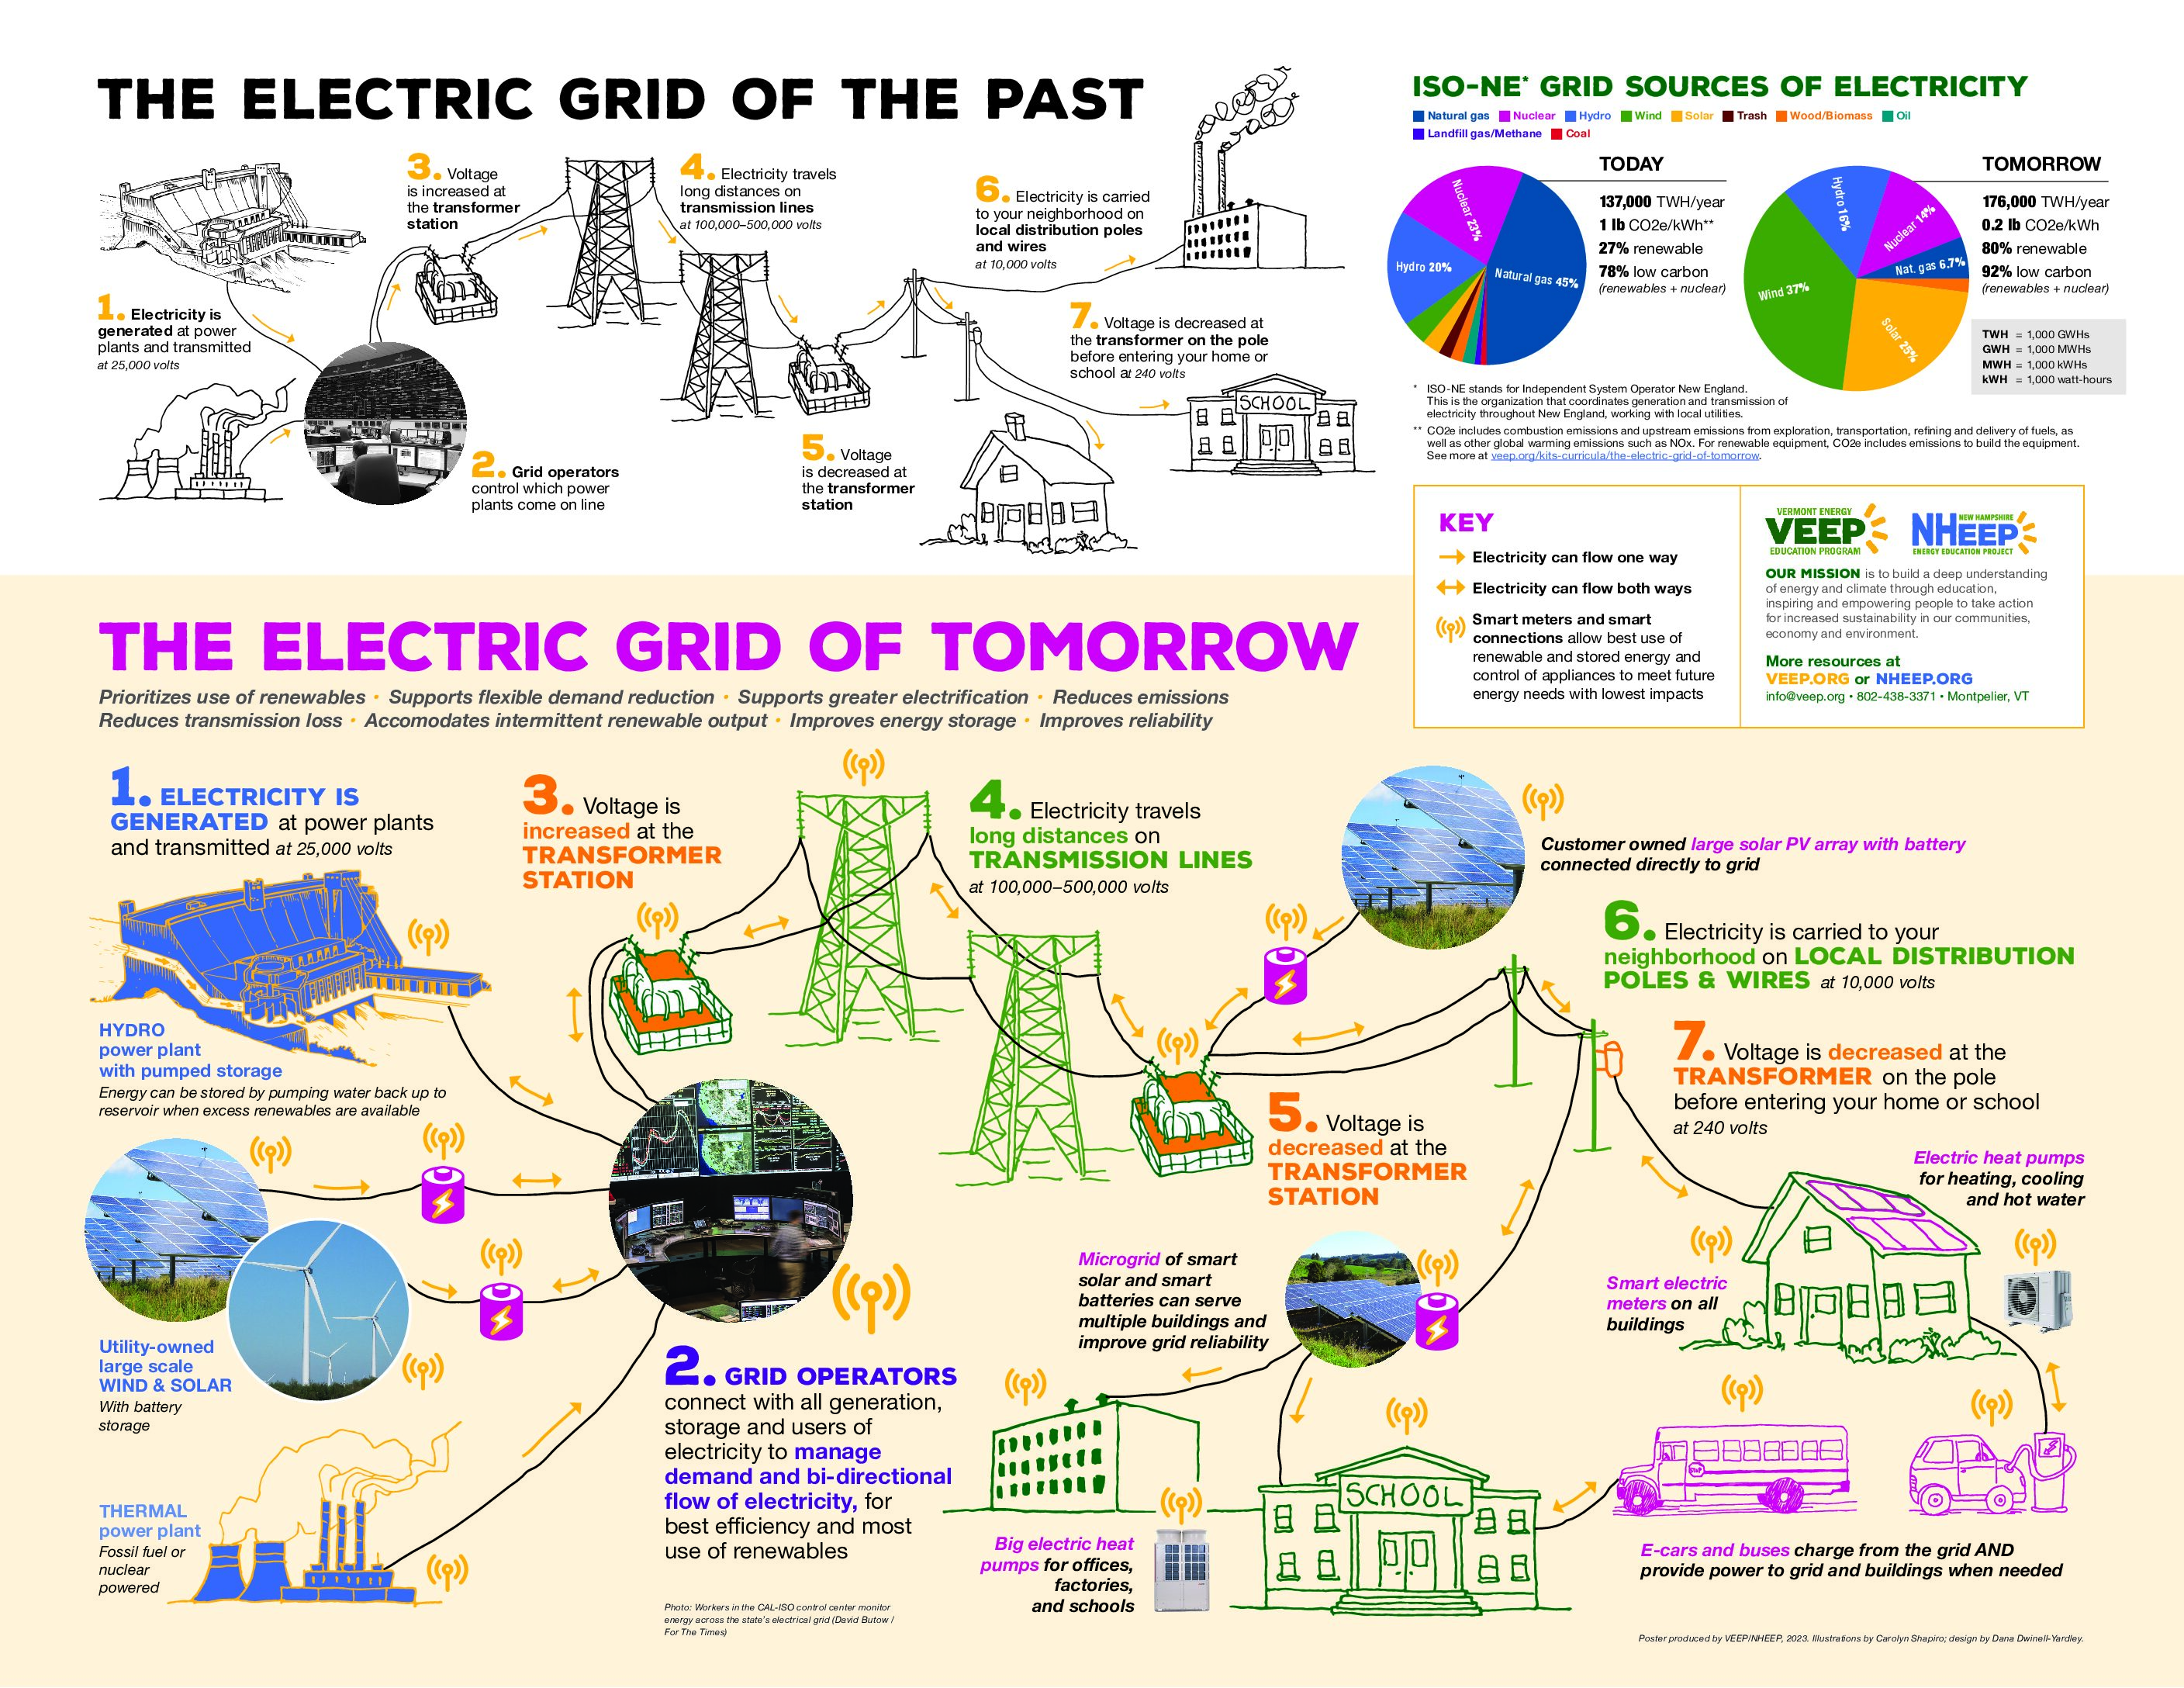
How does the electricity humans generate make it to our homes and businesses? What changes need to happen to make our grid more resilient and efficient for our energy future?…
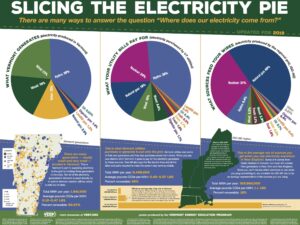
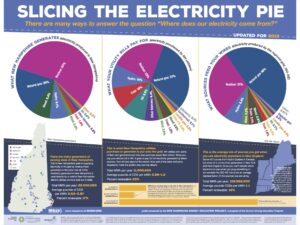
Poster comparing three pie charts of electricity sources: VT generation, what VT utilities purchase, and what comes from the ISO-NE grid.