$0.00
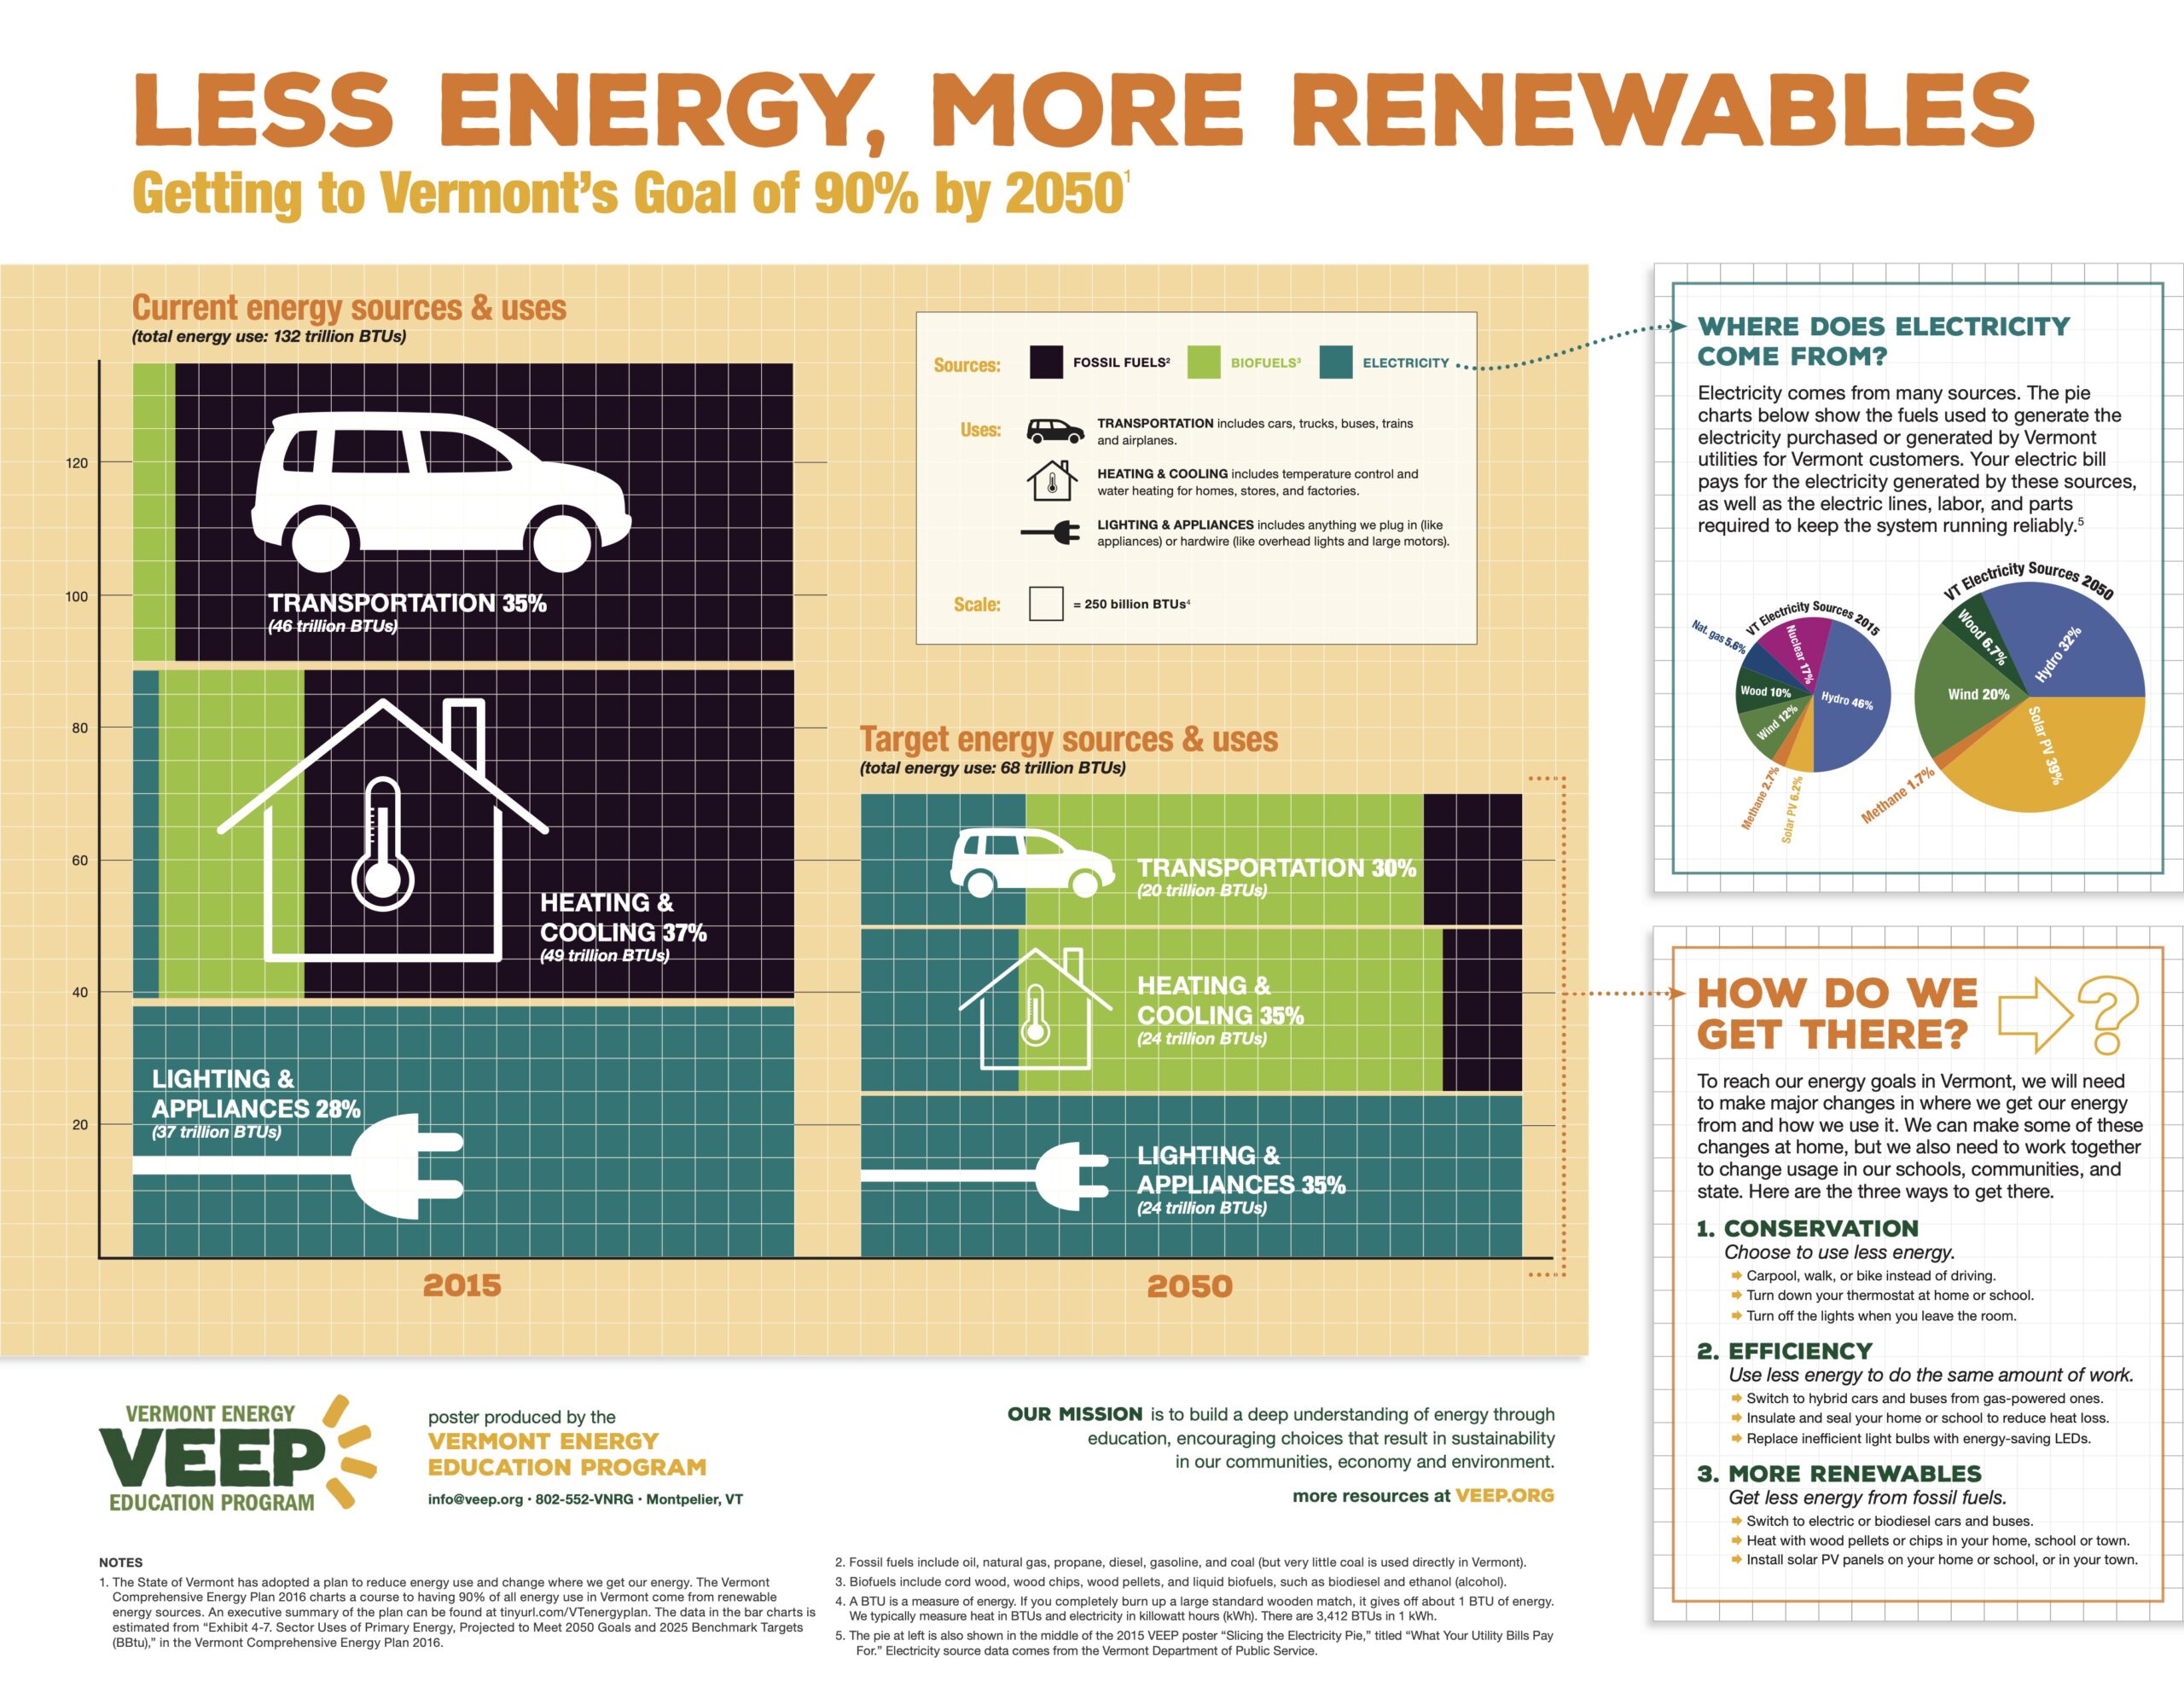
Charts showing Vermont energy use in transportation, thermal, and electricity — and how it would change if we met our state goal of 90% by 2050.
Description
Stacked bar/grid chart comparing our energy use across the three main sectors (electricity, transportation, and thermal) in 2015, and projected for 2050 if we meet our goal of 90% renewable by 2050.
We also have the full-size 22×17 poster available on paper. Please contact us to order copies for your classroom.
Additional information
| Grade Band | |
|---|---|
| Topic | Climate Change, Electricity, Engineering, Heat Transfer, Hydro, Solar, Transportation, Wind |
| Type of Material | |
| State |

