CHARTING OUR ENERGY FUTURE
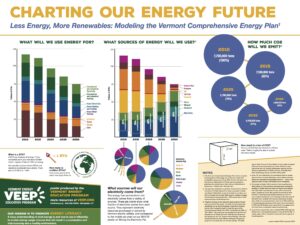
$0.00Poster with charts modeling the Vermont Comprehensive Energy Plan.
Showing 1–21 of 27 results
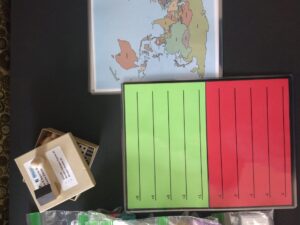
A game to explore how choices have an impact on earth’s resources and climate change
How can we move from place to place cheaply and with fewer emissions? Here you will find the materials you need to conduct the EcoDriving course with your students. EcoDriving Presentation…
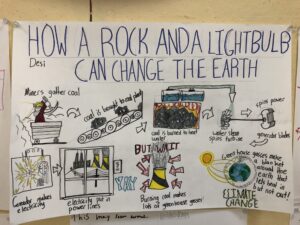
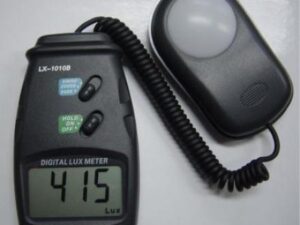
How are humans impacting the climate by turning on this lamp? What can we do about it?
This year’s report highlights how much fossil fuel dependence is currently costing the Vermont economy, as well as how much Vermonters stand to save as a result of a transition to more efficient and renewable technologies in heating and transportation.
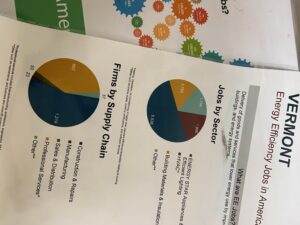
What field are you interested in working in? What is meant by Green or Clean energy jobs?
What field are you interested in working in? What is meant by Green or Clean energy jobs?
Curricula Kit: How/why does human transportation impact earth’s climate? How can we re-engineer local transportation to reduce our impact?
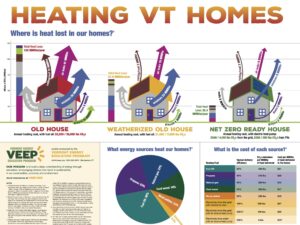
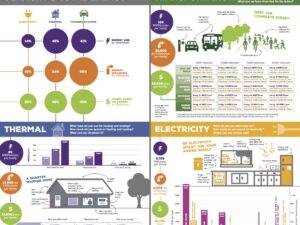
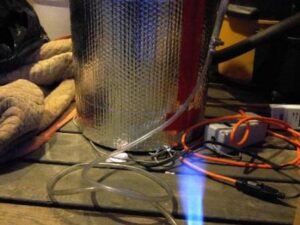
Where does heat leave our homes, what energy sources heat our homes, and what does the energy cost?
Curricula Kit: How/why does keeping homes warm impact the temperature of Earth’s atmosphere? How can we decrease this impact yet keep our homes warm and cozy?
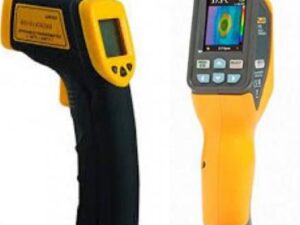
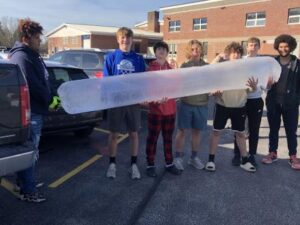
Visual heat transfer and measure surface temperatures in your building.
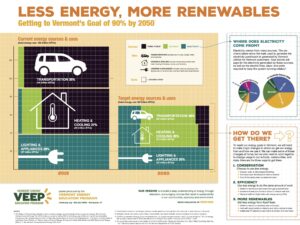
Charts showing Vermont energy use in transportation, thermal, and electricity — and how it would change if we met our state goal of 90% by 2050.
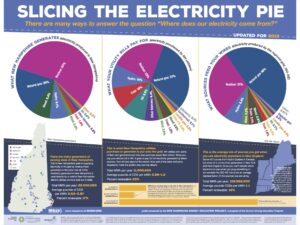
Poster comparing three pie charts of electricity sources: NH generation, what NH utilities purchase, and what comes from the ISO-NE grid.
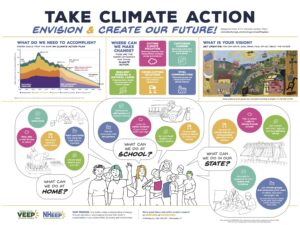
What actions can we take to protect our communities from climate change?
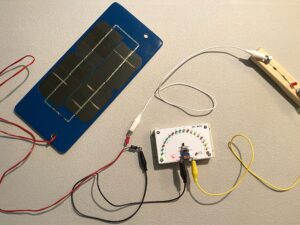
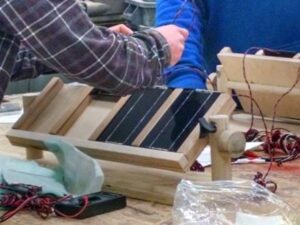
How does installing photovoltaic panels address the community’s electricity needs while helping to protect the earth?
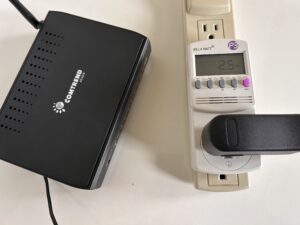
How can new technologies in electrical metering reduce electrical usage and subsequently reduce CO2 emissions?
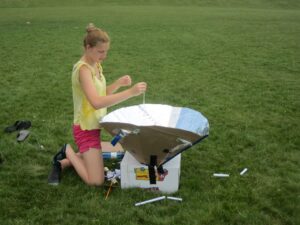
How can we learn to harness the sun’s renewable energy, which benefits people and does not add pollutants, including greenhouse gases, to our air?
Graphic uses data to showcase how transportation impacts our climate.